Performance tests & integration into GitLab CI/CD pipeline (w/ Gatling)
Covered in this article:
- What tools to use to run the performance test
- How to develop the performance test
- How to set up the GitLab pipeline
- Which endpoints to test, on which infrastructure
- Preparing data for the tests
Introduction
Nonfunctional requirements
A bit about the application to test
The system to test is a collection of microservices running on Open Telekom Cloud provider, in a high availability configuration having the persistence assured by MySql relational databases. The application is also interconnected with other systems like SAP, SalesForce, and Enterprise Content Management System via rest interfaces, hooks, and files.
Infrastructure as a code approach is used to spin up the servers and services using Terraform and Ansible. Docker is used to package the application in multiple containers.
CI/CD is set up with GitLab.
The tech stack mainly consists of Java with SpringBoot and Hibernate, Hazelcast, JHipster, Angular with Typescript, and also Docker and K8s.
What are performance tests?
The tools we used
For running the performance tests, we used Gatling, for its easy-to-use capability, good integration with CI/CD tools and DevOps processes, and for the out of the box reporting.
Gatling recorder available in Chrome was sometimes used as a starting point for developing test scenarios.
Scala was used to write the performance test scenarios and Gradle was our build tool.
Docker was used to package our application as containers and Gitlab was used for the CI/CD pipelines with our configured runners.
We used the Spock framework with test scenarios written in Groovy to prepare the test data.
Why integrate performance tests into the CI/CD pipeline?
It is important to make sure that the system performance remains within the defined constraints when continuous development and delivery of features are done at a very high rate.
If the tests are failing, we know that some of the new code broke the performance constraints. Basically, the automated performance tests are run on every merge of a feature branch into certain environment branches. This way we have the confidence, before deploying the new version in production, that the performance for the sensitive or covered scenarios was not affected.
Introduction to Gatling
Recording mode
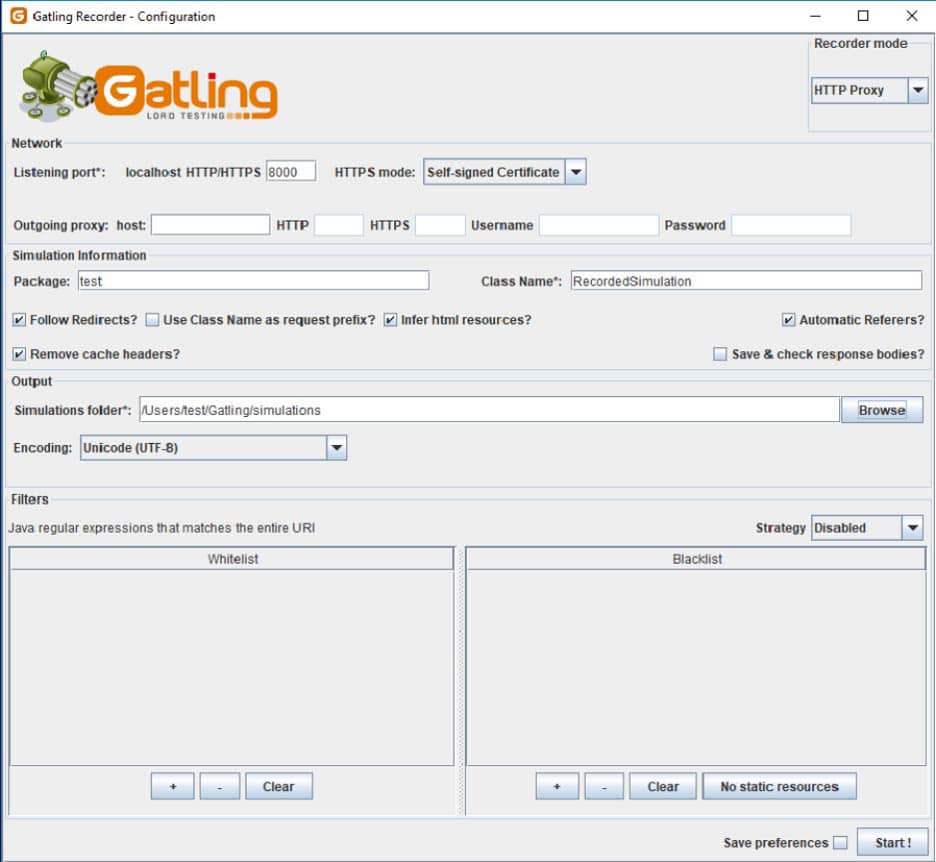
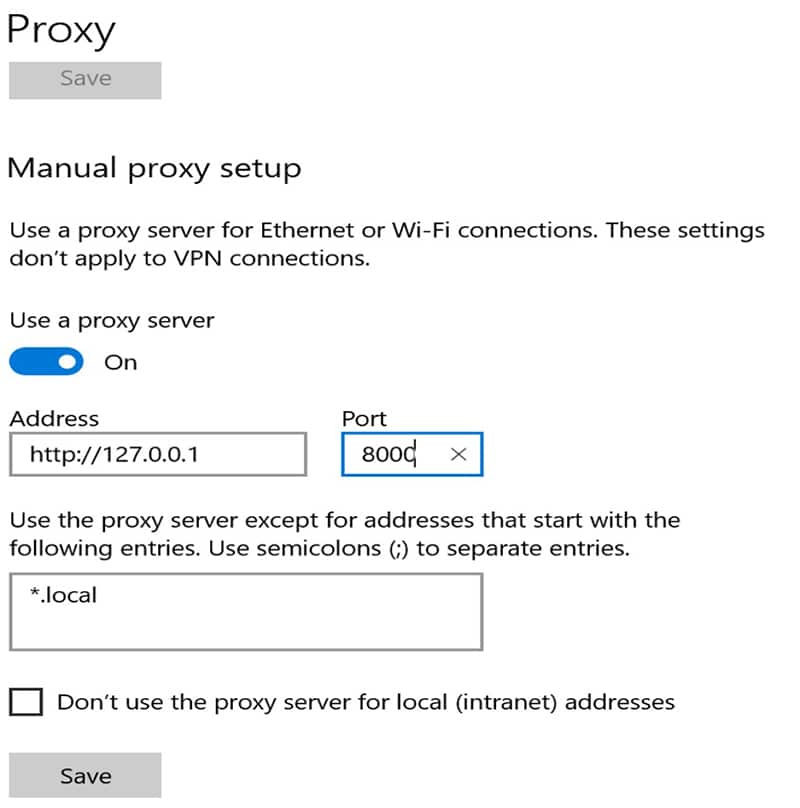
This screen depends on the used operating system. Afterward, the browser should connect to this port.
While the user navigates in the browser, the recorder records the request and pauses and at the end, it generates the simulation code. There are filters that can be defined to filter out those requests – for instance, all requests for CSS files. Also, SSL certificates can be provided or generated on the fly for the HTTPS mode.
The generated code can be used as a starting point for developing the performance simulation, but it has to be reworked to be more maintainable, to ignore the not-needed requests, and to make the right correlations and abstractions.
Simulations
The entry point of a performance test is a simulation. In a single run, the simulations to be executed can be configured. The simulation is the equivalent of a test case in the popular Junit library. It has setup and tear-down methods, but also helper methods for doing assertions and storing global values.
class MyInteractionsTest extends Simulation {

  val context: LoggerContext = LoggerFactory.getILoggerFactory.asInstanceOf[LoggerContext]
  // Log all HTTP requests
context.getLogger("io.gatling.http").setLevel(Level.valueOf("TRACE"))val httpConf = http
.baseUrl(PerfConstants.baseURLServer)
.inferHtmlResources()
.header("Origin", PerfConstants.baseURLServerWeb)
.acceptHeader("application/json, text/plain, application/hal+json, application/problem+json, */*")
.acceptEncodingHeader("gzip, deflate")
.acceptLanguageHeader("en,en-US;q=0.9,ro-RO;q=0.8,ro;q=0.7,de;q=0.6")
.connectionHeader("keep-alive")
.userAgentHeader("Mozilla/5.0 (Windows NT 10.0; Win64; x64) AppleWebKit/537.36 (KHTML, like Gecko) Chrome/71.0.3578.98 Safari/537.36")
.disableWarmUp
.silentResources // Silence all resources like css or css so they don't clutter the resultsHere we are configuring the HTTP protocol. We set up the HTTP headers with the expected values simulating the browser requests. The origin header is set to the provided server URL to avoid CORS issues. The static resources, like CSS files, and their failures are generating a lot of noise, so we want to disable the reporting for them via the silentResources flag.
Inferring the HTML resources means to mimic the browser behavior of loading async the embedded resources like scripts, links, images, frames, objects, and so on.
val headers_http_authenticated = Map(
  "Content-Type" -> """application/json""",
  "Accept" -> """application/json, application/hal+json, application/problem+json""",
  "Authorization" -> "${access_token}",
)
For different requests, we might need different headers. The above variable contains the headers for an authenticated request. The access token is provided as a value for the authorization header. The token was previously saved by a login request in a virtual user session via a mechanism called checks. The checks are used to validate the requests and extract values that can be later reused.
One such login request can look like this:
object Login {

  val headers_http_authentication = Map(
    "Content-Type" -> """application/json""",
    "Accept" -> """application/json, application/hal+json, application/problem+json""",
  )

  val login =
    exec(http("Authentication")
      .post("/auth/token")
      .headers(headers_http_authentication)
      .body(StringBody("""{"username":"adm@project.com", "password":"*****"}"""))
      .check(status.is(PerfConstants.HTTP_STATUS_OK))
      .check(header("Authorization").saveAs("access_token"))
    ).exitHereIfFailed
}
There is a login request object with a header for not authenticated users, not containing any tokens.
Via the exec method, an HTTP post call is executed to the /auth/token endpoint providing the credentials in the body. The check constructs are validating the response status and are saving the access token received back in the authorization response header.
The request can be executed as part of a scenario via a fluent API:
val scn = scenario("My interactions")
.exec(Login.login).exitHereIfFailedval scn = scenario("My interactions")
.exec(http("First unauthenticated request")
.get("/auth/user")
.headers(headers_http)
.check(status.is(401))
).exitHereIfFailed
.pause(3)
.exec(Login.login
).exitHereIfFailed
.pause(2)
.exec(http("Authenticated request")
.get("/auth/user")
.headers(headers_http_authenticated)
.check(status.is(200)))
.pause(3)
.exec(NavigationTree.navigationTree)
.exec(MyInteractions.myInteractions)After each request, checks can be performed, then exit if the conditions are not matching. Also, breaks can be injected to simulate a human user.
The other scenario requests are looking similar to the login request but using different HTTP methods and checks.
val navigationTree =
  exec(http("Navigation EndPoints")
    .get(PerfConstants.baseURLServer + " /navigationTree ")
    .headers(headers_http_authenticated)
    .check(status.is(PerfConstants.HTTP_STATUS_OK))
    .check(jsonPath("$.mainObjects[0].mainObject.aid").saveAs("firstOrder")))
    .pause(PerfConstants.PAUSE_BETWEEN_REQ_IN_SEC)
There is a get request performed for an authenticated user, and the value is saved from the parsed JSON response in the virtual session variable called firstOrder.
Each scenario has a setup phase, where the number of concurrent users and the ramp-up period are defined.
setUp(scn.inject(rampUsers(20) during (2 seconds))).protocols(httpConf)
In our case, 20 users are running the same scenario, and all are starting to create the first request in a 2 seconds interval. This means that after two seconds we will have at least 20 requests in progress.
The scenario execution starts with the construct:
scenario("My navigation").exec(scn)Expected thresholds
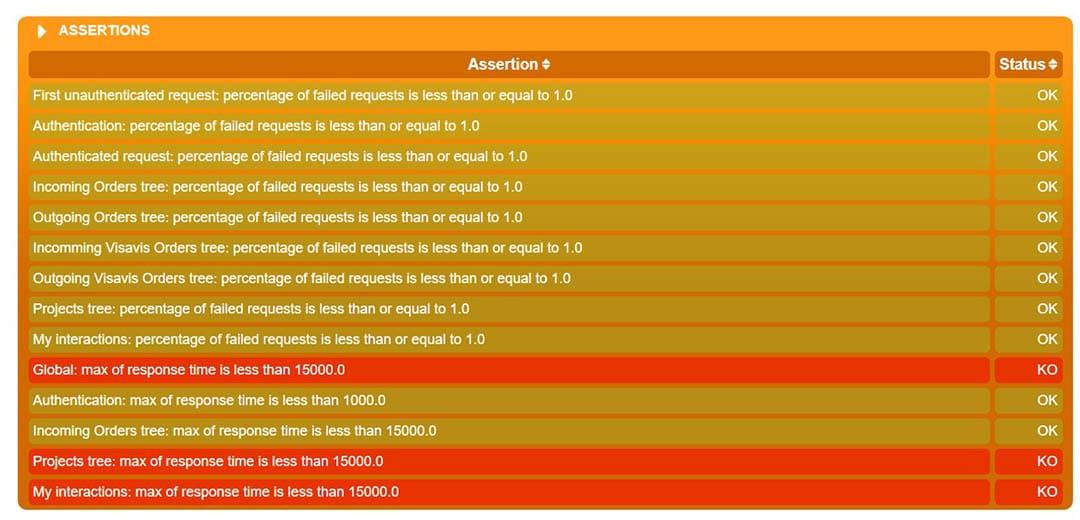
Expected response/time thresholds can be defined globally for all requests or scenarios, but also for individual requests. The values must also take into consideration the infrastructure on which the tests are running and must be adjusted accordingly. Usually, the production infrastructure is more powerful than in the other environments. It was not an easy task to define the right values that also give us the expected ones in production.
In the scenario setup phase also, the expected thresholds are defined:
setUp(scn.inject(rampUsers(20) during (2 seconds))).protocols(httpConf)
  // Assert that every request has no more than 1% of failing requests
  .assertions(forAll.failedRequests.percent.lte(1))
  // Assert that the max response time of all requests is less than 5000 ms
  .assertions(global.responseTime.max.lt(PerfConstants.MAX_RESPONSE_TIME_MS))
  // Assert that the max response time of authentication requests is less than 3000 ms
  .assertions(details("Authentication").responseTime.max.lt(PerfConstants.MAX_RESPONSE_TIME_AUTH_MS))
  // Assert that the max response time of the navigation tree requests is less than 5000 ms
  .assertions(details("Navigation tree").responseTime.max.lt(PerfConstants.MAX_RESPONSE_TIME_MS))
  // Assert that the max response time of the my interactions requests is less than 5000 ms
  .assertions(details("My interactions").responseTime.max.lt(PerfConstants.MAX_RESPONSE_TIME_MS))
One can do assertions for all requests of certain types, like failed request with the construct forAll.
Assertions can be also done for all requests of any type with the construct global.
For a particular request identified by the path, assertions can be made with the statement details(“request group / request path”).
More assertions can be made on metrics such as the number of successful requests or the number of requests per second. Count or percentage values are available for comparison, while multiple conditions can be chained together. Comparison operators like between, around, and deviatesAround(target, percent) are available.
Setup the GitLab pipeline
The pipeline is configured in the .gitlab-ci.yml file residing in the performance test project root.
There is a single stage called test.
stages:
  - test
Docker image to use
One challenge we had was to find a docker image with all the needed Scala and Gatling libraries ready to be used without too much struggle. The GitLab runner should be able to pull this image, check out the code and launch the tests via a bash script.
After several tries, we found the image koosiedemoer/netty-tcnative-alpine that worked in our environment.
perftest-master:
  image: koosiedemoer/netty-tcnative-alpine
  stage: test
Execution trigger
There are two events that are causing the performance tests to run.
One event is by doing a commit for the performance test project into our master branch.
perftest-master:
…
  only:
    - master
  except:
    variables:
      - $EXECUTE_TEST_FOR_ENVIRONMENT =~ /^TEST/
The step is executed only on the master branch when the environment variable EXECUTE_TEST_FOR_ENVIRONMENT is not defined or does not start with TEST. The variable is used to identify if an external trigger caused the execution – in case we need some different action/config to perform.
The other event is when called externally, after a certain step in another project pipeline.
perftest-master:
  stage: perftest
  image: registry.gitlab.com/finestructure/pipeline-trigger
  script:
    - apk --no-cache add bash curl
    - ./ci/bin/perf-trigger.sh
  tags:
    - perftrigger
  only:
    - master
In a microservice project, in the GitLab CI pipeline config file a perftest stage is defined that pulls the pipeline-trigger docker image, installs the required packages, and executes the checked-out script perf-trigger.sh.
This step is only executed when there is a commit on the master branch, and only after the previous pipeline stages are executed.
The bash file contains something like:
trigger -a ${APP_GITLABTRIGGER_APITOKEN} -p ${APP_GITLABTRIGGER_PERFTESTTOKEN} -t ${branch} ${APP_GITLABTRIGGER_PERFTESTID} -e EXECUTE_TEST_FOR_ENVIRONMENT=TESTThe docker image contains the trigger command where GitLab tokes are provided, the target pipeline, the branch, and environment variables.
In the performance test project, another stage can be defined only for the external trigger.
perftest-master-ext:
…
only:
    - master
only:
  variables:
- $EXECUTE_TEST_FOR_ENVIRONMENT =~ /^TEST/Execution setup
perftest-master:
…
  script:
    - apk --no-cache add bash
    - ./bin/testperf.sh "https://apistage.domain.net"
  tags:
    - perftests
  artifacts:
    when: always
    paths:
      - build/reports/gatling/*
    expire_in: 1 week
…
In the script section, the missing packages are installed in the running container and the testperf.sh bash file is executed passing the stage environment as base API URL.
The tag identifies the label for the GitLab runner that will execute the tests.
The artifacts section configures the destination for saving the reports, and how long to keep them available for download.
The bash file starts the Gradle command for running the test against the provided environment:
./gradlew gatlingRun -DbaseURL=${1}In the gradle.build file we are using the Gatling plugin and configure which tests to run and where to store the reports like in the following:
plugins {
   id "com.github.lkishalmi.gatling" version "3.0.2"
}
…
apply plugin: "com.github.lkishalmi.gatling"
..
gatling {
…
	simulations = { include "**/*Test.scala" }
}
task testReport(type: TestReport) {
    destinationDir = file("$buildDir/reports/tests")
    reportOn test
}
…
Preparing the data and the infrastructure for running the tests
On which systems to execute the tests
There are at least two ways to do it. One way is to spin up a new environment and deploy the application on that clean environment with a well-defined configuration and capacity. Another way is to run the performance test on an existing environment with a fixed capacity and known configuration.
You can also run the tests from time to time on production if you can afford to scale it or to find a time slot (maintenance window) when the users are not disturbed.
We have chosen to run the performance against our staging environment because this is comparable with our production environment, and because we didn’t want to wait for spinning up another clean environment. Also, the production users are not affected by running the tests often.
Which endpoints to test
Each application has its own specifics and solves clear business needs. The most used business scenarios must be tested to make sure that the application stays in the agreed performance parameters. Also, one must consider the activities with the most risk of affecting the performance.
Another approach would be to use monitoring tools to track the user activity, then analyze the critical points and the response times of the application, in order to decide what performance tests to write.
We used both approaches and identified good candidates such as the authentication endpoints, authorization checking, some heavy lists of resources, and part of business logic.
Populating the data
The data for the performance test can be a backup of the production database that can be restored in a reasonable amount of time.
In case an existing environment is used for running the performance test, then some test users can authenticate and perform the scenarios.
In our case, we are using the test users and data created by our integration tests. This is a prerequisite. Our integration tests are developed in Groovy using the Spook framework and are executing HTTP requests calling our REST APIs to populate the data.
Spook tests can be written like the popular JUnit tests. There is a base class to extend called Specification that provides helper methods for mocking, stubbing, and spying. It is equivalent to a test case of Junit.
class BaseSpec extends Specification {

@Shared
public static HttpBuilder client
Groovy sort of HTTP client is used for executing the API calls. The client is configured with a helper serialization library called JsonSlurper. The methods can be executed in order if we are using the @Stepwise annotation.
There are setup and cleanup methods executed before every test method and setupSpec and cleanupSpec executed before and after every specification.
One sample of setup method can initialize the HTTP client and login the admin user.
def setupSpec() {
    client = HttpBuilder.configure {
    request.uri = BASE_URL_SERVER
    request.setContentType('application/json')
    response.success { resp, data ->
     if (data != null){
     }
    }
    …
    loginAs(admin)
}def 'give ROLE_ADMIN privilege to the user'() {
given: 'a valid ADMIN privilege'
def privilege = [
scope : 'RESOURCE',
key : 'ROLE_ADMIN',
user : [
aid: userAid
],
role : [
aid: ROLE_ADMIN_LICENSE
],
resource: [
aid: ROOT_COMPANY_AID
]
]
when: 'I post the privilege'
def response = client.post {
request.uri.path = '/privileges'
request.body = privilege
}
then: 'the privilege was created'
assertResponseStatus(response, 201)
}
A privilege request is created, and an HTTP POST is sent to the server. In the end, the 201-HTTP status is checked, but it can check also the structure of the response.
Multiple specs can be grouped in a test suite and executed at once.
@RunWith(Suite.class)
@Suite.SuiteClasses(
        [
                AnInitTestSuiteSpec,
                AnotherWorkflowSpec
	]
)
class TestSuite {
}test{
systemProperty "target", findProperty("target")
systemProperty "targetServer", findProperty("targetServer")
testLogging {
exceptionFormat = 'full'
}
filter {
//specific test method
includeTestsMatching "specs.TestSuite"
}
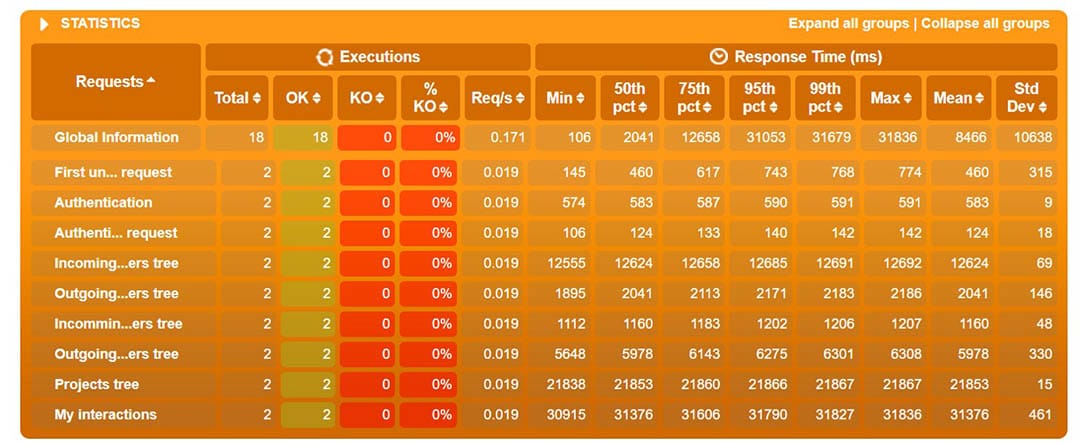
}Performance tests reports
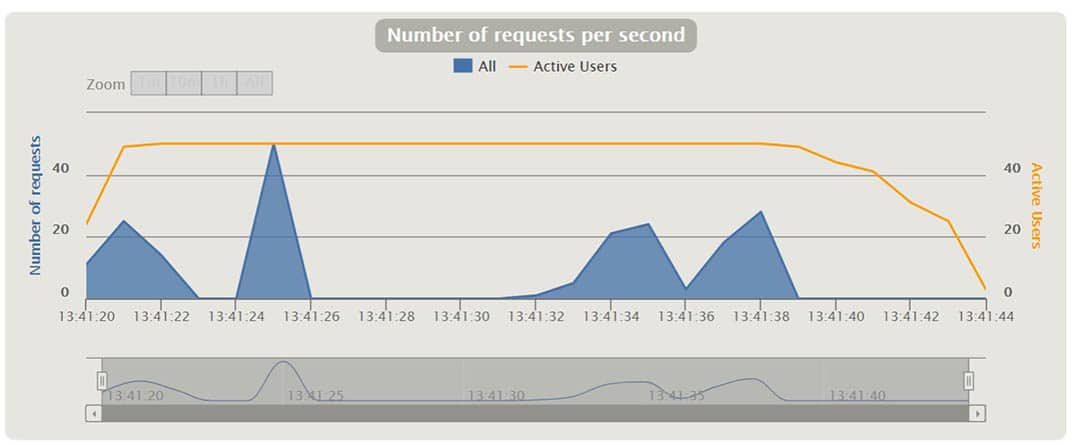
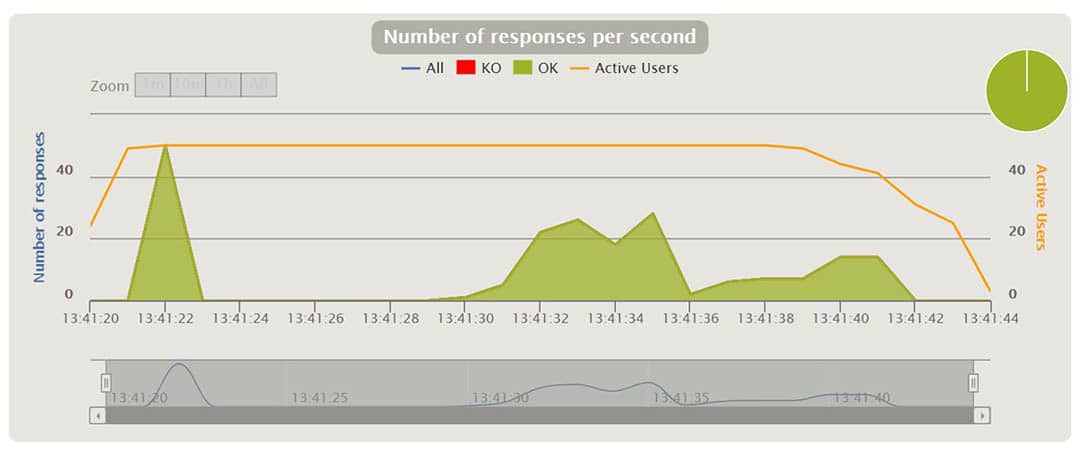
Gatling creates a nice set of reports after running the scenarios. In the charts we can see things like response time, requests per second, throughput, mean times, and percentiles distributed over time and users. With some of the charts, one can interact and show additional info as a tooltip or zoom in and out the time interval. I will explain some of them when running different scenarios in the following.
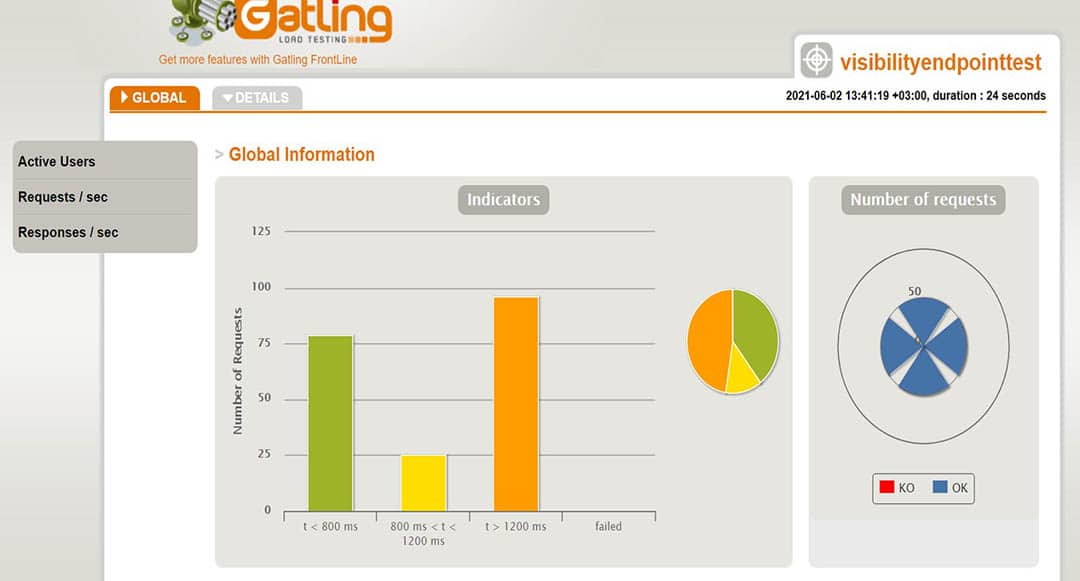
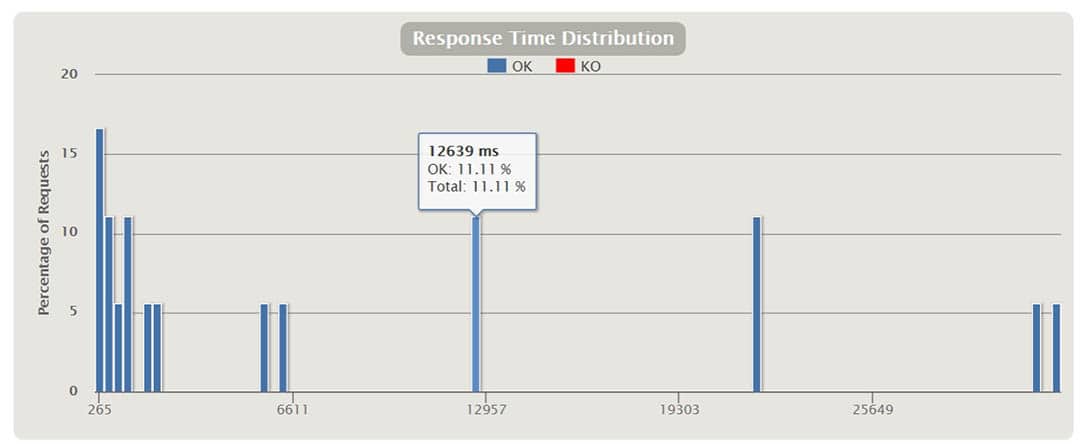
In the above chart, we see the percentages of response times, distributed in time ranges in milliseconds.
For instance, we can see that 17% of the requests took around 265 ms.
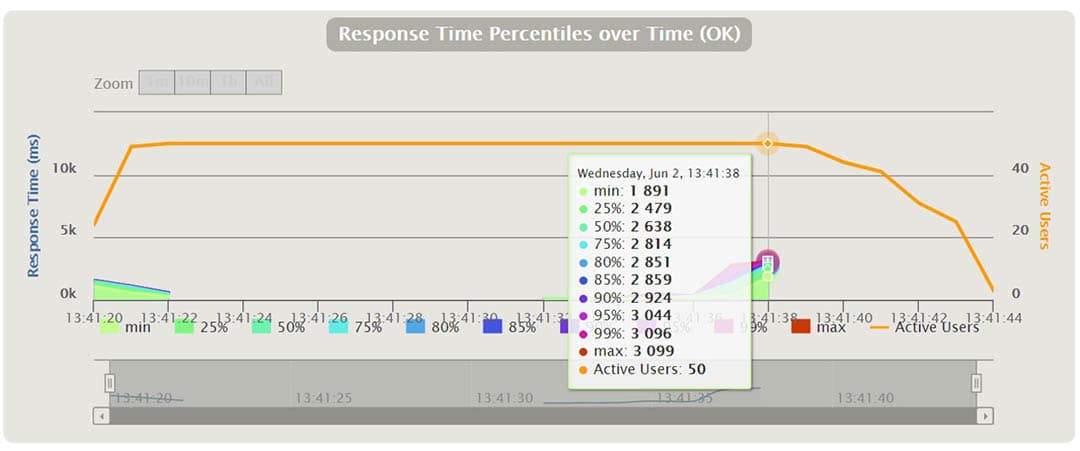
At a certain point in the above chart, we can see the percentages of the running requests and their response time in ms. We can zoom in and out the time interval.
Conclusions
It was challenging to integrate and run performance tests into the CI/CD pipeline on a regular basis. We talked about one way to do it, that worked for us. We’ve touched a bit on the challenges we faced, the tools used, how to write the tests and how to prepare the data for them. We hope you enjoyed it!
Should you have any questions, don’t hesitate to contact us.
***
How do you do it? Care to share your solution?